3. 参考序列比对
参考序列比对(Reads Mapping)是指将经过下机处理的原始数据(Sequenced Reads)比对到参考基因组上。嘉因生物采用主流分析软件STAR对RNA-seq测序数据进行比对分析。STAR采用Maximal Mappable Prefix(MMP)搜索方法,可以对junction reads进行精确定位,如下图3.3.1所示,其综合性能在同类比对软件中表现较为突出。
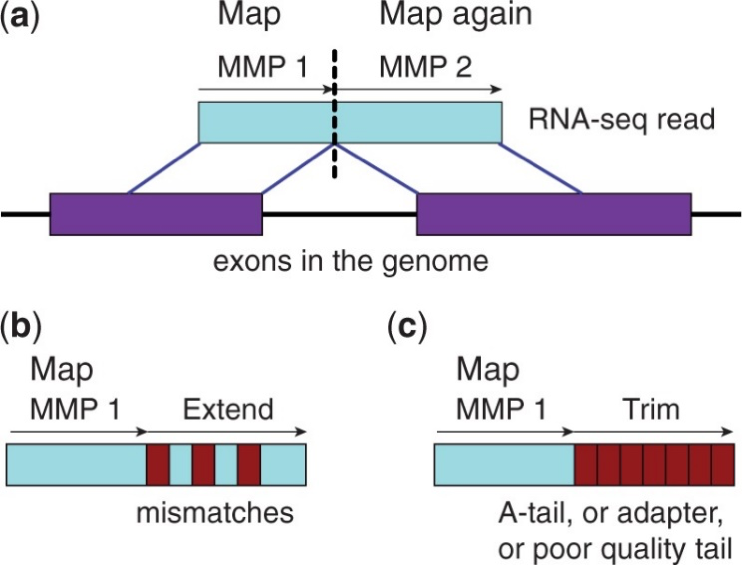
图3.3.1 数据回帖原理
3.1 Reads与参考基因组比对情况统计
表2 参考序列比对结果统计表
| Control1 | Control2 | Control3 | Treat1 | Treat2 | Treat3 | |
|---|---|---|---|---|---|---|
| Number of input reads | | 23624094 | 23967327 | 24004478 | 21566180 | 21623553 | 21555629 |
| Average input read length | | 300 | 300 | 300 | 300 | 300 | 300 |
| UNIQUE READS: | ||||||
| Uniquely mapped reads number | | 21894148 | 21858030 | 21986062 | 19906147 | 20067278 | 19758528 |
| Uniquely mapped reads % | | 92.68% | 91.20% | 91.59% | 92.30% | 92.80% | 91.66% |
| Average mapped length | | 296.92 | 296.65 | 296.56 | 296.81 | 297.05 | 296.63 |
| Number of splices: Total | | 23702756 | 23606514 | 23938109 | 21700625 | 21958587 | 21420931 |
| Number of splices: Annotated (sjdb) | | 23161183 | 23113486 | 23444298 | 21214359 | 21509837 | 20962507 |
| Number of splices: GT/AG | | 23439822 | 23352787 | 23678758 | 21464862 | 21727207 | 21193348 |
| Number of splices: GC/AG | | 207449 | 201223 | 205535 | 188090 | 184709 | 180643 |
| Number of splices: AT/AC | | 18286 | 17244 | 17639 | 15743 | 16268 | 15773 |
| Number of splices: Non-canonical | | 37199 | 35260 | 36177 | 31930 | 30403 | 31167 |
| Mismatch rate per base, % | | 0.31% | 0.36% | 0.38% | 0.33% | 0.35% | 0.36% |
| Deletion rate per base | | 0.01% | 0.01% | 0.01% | 0.01% | 0.01% | 0.01% |
| Deletion average length | | 2.16 | 2.19 | 2.14 | 2.16 | 2.11 | 2.19 |
| Insertion rate per base | | 0.02% | 0.01% | 0.01% | 0.01% | 0.01% | 0.01% |
| Insertion average length | | 1.51 | 1.53 | 1.53 | 1.51 | 1.53 | 1.53 |
| MULTI-MAPPING READS: | ||||||
| Number of reads mapped to multiple loci | | 401512 | 421307 | 413327 | 353764 | 372265 | 382722 |
| % of reads mapped to multiple loci | | 1.70% | 1.76% | 1.72% | 1.64% | 1.72% | 1.78% |
| Number of reads mapped to too many loci | | 3546 | 3865 | 3874 | 3315 | 3129 | 3567 |
| % of reads mapped to too many loci | | 0.02% | 0.02% | 0.02% | 0.02% | 0.01% | 0.02% |
| UNMAPPED READS: | ||||||
| % of reads unmapped: too many mismatches | | 0.00% | 0.00% | 0.00% | 0.00% | 0.00% | 0.00% |
| % of reads unmapped: too short | | 5.57% | 6.99% | 6.63% | 6.00% | 5.42% | 6.50% |
| % of reads unmapped: other | | 0.04% | 0.04% | 0.04% | 0.04% | 0.04% | 0.04% |
注:
1) Number of input reads:RNA-seq原始数据下机处理后,参考序列比对分析中输入序列数目统计;
2) Average input read length:序列平均长度统计;
3) Uniquely mapped reads number: 特异性回帖至参考基因组上的序列数目统计,即序列只回帖至参考基因组某一特定位置;
4) Uniquely mapped reads %: 特异性回帖至参考基因组上的序列百分比统计;
5) Average mapped length: 回帖至参考基因组上的序列平均长度统计;
6) Number of splices: Annotated(sjdb): 已经注释的可变剪接数目统计(即这部分可变剪接出现在参考文档.gtf中);
7) Number of non-canonical splices:未经注释的可变剪接数目统计;
8) Mismatch rate per base: 错误匹配百分比统计(一般≤0.8%);
9) Deletion rate per base:缺失百分比统计;
10) Deletion average length: 缺失长度平均值统计;
11) Insertion rate per base:插入百分比统计;
12) Insertion average length: 插入长度平均值统计;
13) Number of reads mapped to multiple loci: 回贴至参考基因组多个位点的序列数目统计;
14) % of reads mapped to multiple loci: 回帖至参考基因组多个位点的序列百分比统计;
Number of reads mapped to too many loci: 如果序列回帖至参考基因组的位置个数大于10,则被认为是改序列为 “too many loci”;
15) % of reads mapped to too many loci: “too many loci”百分比统计;
16) % of reads unmapped: too many mismatches: 序列中包含太多的错配而造成的回帖失败;默认值为序列长度的30%(0.3*read length)或10个以上错配;
17) % of reads unmapped due to too short: 序列太短造成的回帖失败;默认值为2/3序列长度;
18) % of reads unmapped due to other reasons: 其他原因造成的回帖失败。
3.2 Reads在参考基因组不同区域的分布情况
将比对到基因组上的reads分布情况进行统计,定位区域分为Exon(外显子)、Intron(内含子)、Intergenic(基因间区)和。在基因组注释较为完全的物种中,比对到Exon(外显子)的reads含量最高,比对到Intron(内含子)区域的reads来源于pre-mRNA的残留及可变剪接过程中发生的内含子滞留事件导致的,而比对到Intergenic(基因间区)的reads是因为基因组注释不完全。
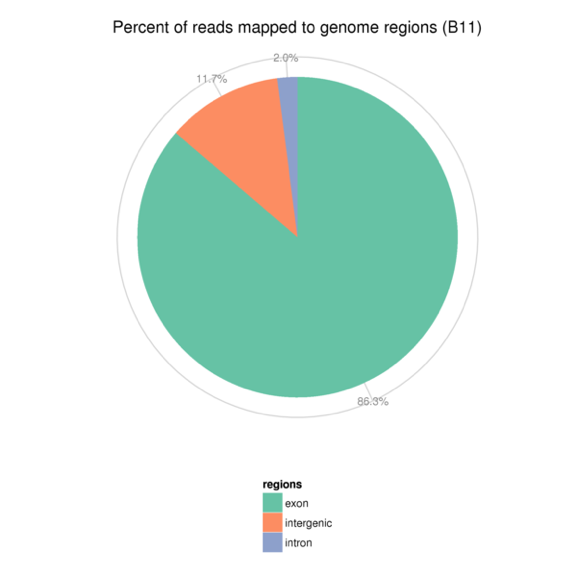
图3.3.2 Reads在参考基因组不同区域的分布情况
3.3 Reads在染色体上的密度分布情况
对Total mapped reads比对到基因组上各个染色体(分正负链)的密度进行统计,如下图所示,正常情况下,整个染色体长度越长,该染色体内部定位的reads总数会越多(Marquez et al. 2012)。从定位到染色体上的reads数与染色体长度的关系图中,可以更加直观看出染色体长度和reads总数的关系。(图中最多只展示其中15条染色体)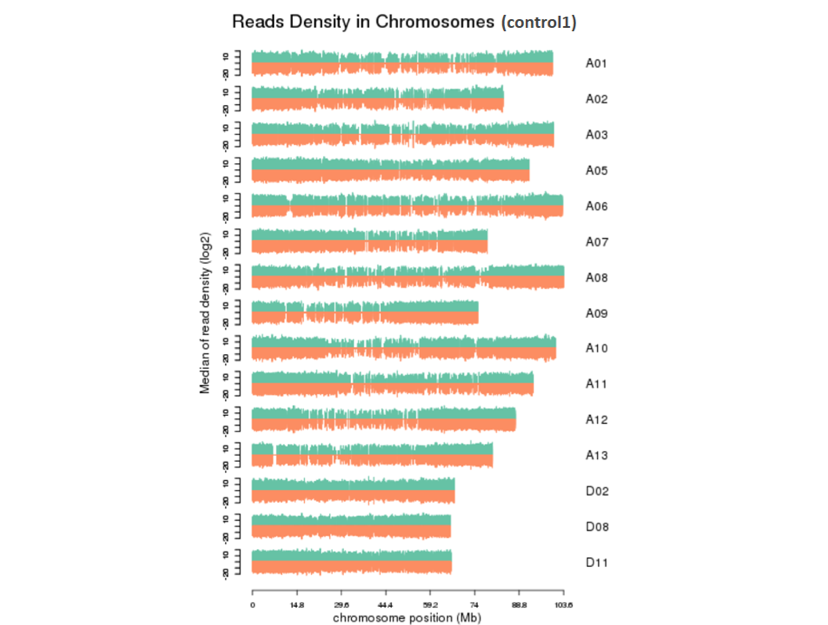
图3.3.3 Reads在染色体上的密度分布图